Gastroenterology EHR Data Analytics: The Top 12 Reports Every Practice or ASC Needs

Using ERW or EHR Data for GI Analytics
KPIs help practice administrators understand how their business is performing at any given time, so they can make informed decisions. Gastroenterology data analytics can also measure quality at a patient level and a procedure level, helping administrators see where there are opportunities to improve. Yet, many gastroenterology offices and ASCs lack the resources, including staff and integrated software, to analyze the data across all aspects of the business. Instead, they are left to put the pieces (i.e., spreadsheets) together.
ERW and EHR data analytics can give gastroenterology practices and ASCs greater visibility into this information, so they can investigate cause-effect relationships, compare their data to CMS benchmarks, and more importantly, use the information to enact change in workflows and processes, and adjust strategies and goals.
How so? Let’s take a look at some of the top reports and gastroenterology KPIs used across the industry and how the data can be utilized.
Financial gastroenterology reports

Month-End Financial Reports
These reports provide standard financial reporting for month-end review. With the ability to analyze your financial production, you can gain clarity on the financial health of the practice and can observe trends month over month to make business decisions.
Expected Receivables Report
As a healthcare provider or organization, you want to understand aging receivables based on insurance fee schedules, so you can prioritize billing workflow and predict month-end finances.
Collection Report
Gain insight into the outstanding patient amount that is about to be sent to collections. Such a report allows you to see how much of your AR can be written off, for a more realistic view. Ideally, it would also include new collection guidelines from the Consumer Financial Protection Bureau to help facilitate compliance and understanding.
Underpayment Report
Collect what you are owed! Analyze the expected payment amount versus the amount paid so that any variances can be tracked and adjusted as needed, based on the contracted rate.
Valuable Financial Gastroenterology KPIs
- Days in AR
- Days sales outstanding
- Revenue realization rate
- Net collections rate
- First pass clean claim rate
- Denial rate
- Out-of-network losses
Collecting data about gastro health: clinical reports

In-Depth Colon Report
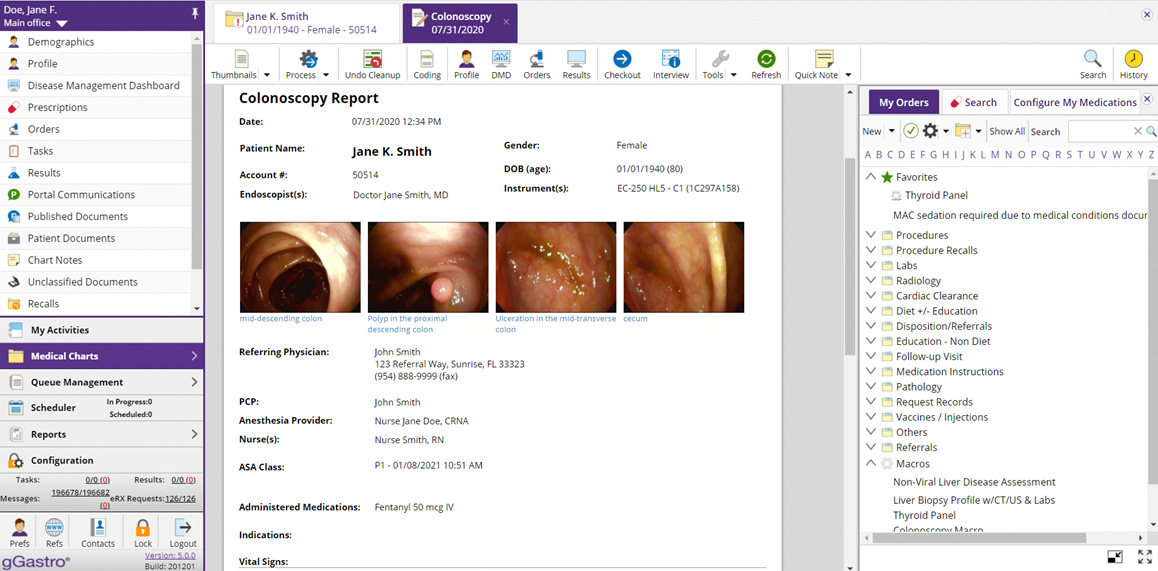
Track various clinical KPIs specific to colonoscopies, such as the adenoma detection rate, and analyze trends.
In-Depth Procedure Report
Understand and track complication rate and type (such as bleeding) as well as ASA classes of sedation.
IBD Reporting Dashboard
View IBD patient data, including Crohn’s, ulcerative colitis and indeterminate colitis, so you can identify a specific group of IBD patients by ICD code, evaluate medication lists and more.
Valuable Clinical Gastroenterology KPIs

- Cecum photo documentation
- Entire colon examined
- Inadequate prep rate
- Average withdrawal time
- MIPS/MACRA
- Percentage of IBD patients
- Outstanding orders
- Indication for colonoscopy
- Advance imaging assessment
- Cecal intubation rate
- Polyp retrieval rate
- Colon service count
- Detection rates
- Adenoma detection rate (ADR)
- Polyp detection rate (PDR)
Operational gastroenterology reports

Appointment Report
Track current numbers and last year to date for comparison and insight into practice growth or decline.
Appointment Flow
View appointments over time to track scheduling productivity overall and by location and user.
Tasking Report
Track end-user productivity, including average hours to view and average hours to complete.
Recall Report
Help facilitate patient compliance with a high-level picture of patient colonoscopy recalls, versus entering each individual patient record.
Patient by Referral Source
Quickly and easily identify referral sources for your practice or endoscopy center and monitor referral trends by referring provider and for each practice/center location.
Valuable Operational Gastroenterology KPIs
- Clinical staff per room
- Encounters per room
- Recall rate
- Flow-through rates
- Average preprocedure time
- Average intraprocedure time
- Average postprocedure time
- Average total procedure time
- Procedures per room
- Device costs per encounter
- Appointment statistics
- Cancellation rate
- Completion rate
- Late cancellation rate
- Same-day cancellation rate
How gastroenterology data analytics can help your practice
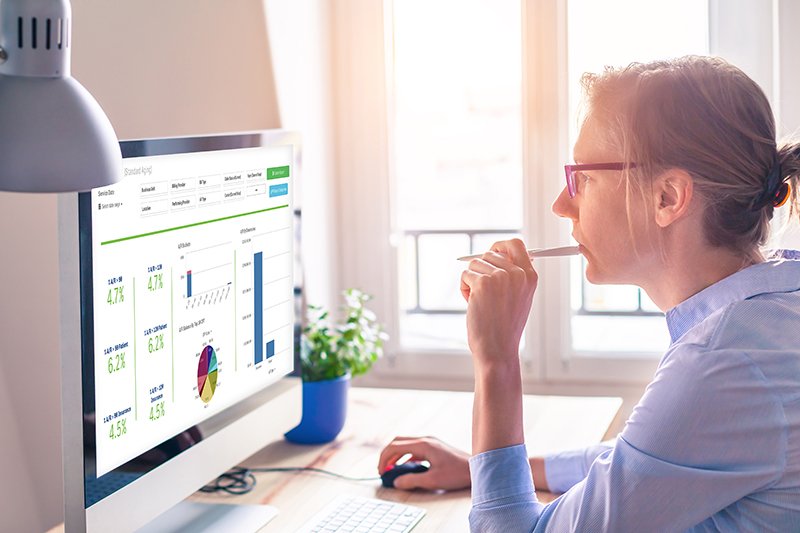
gInsights™, our gastroenterology data analytics platform, brings your clinical, financial and operational data together in one integrated system and one database, so you can get better visibility and more comprehensive reporting.
Once you understand the overall health of your GI practice or endoscopy center, you can start making the necessary changes to processes and workflows that power practice and ASC performance.
This blog is intended for informational purposes only and does not constitute legal or medical advice. Please consult with your legal counsel and other qualified advisors to ensure compliance with applicable laws, regulations, and standards.