A Close Look at Urology Practice Data With ModMed Analytics

See how you can benchmark and track practice performance with urology analytics
The urology electronic health record (EHR) system from ModMed® offers seamless data collection, tracking and analysis that physicians, practice owners and staff can use to monitor overall practice health.
Our all-in-one software solution centralizes your workflows and operations, generating extensive datasets that incorporate information from patient visits, billing, third-party partnerships, APIs and more.
This data is readily accessible within the ModMed EHR system, empowering you to uncover insights that promote cost efficiency, revenue management and a deeper understanding of how internal and external trends impact your practice’s financials and operations:
View data across formats: Delve into raw data, examine tables, and grasp the bigger picture through data visualizations that offer quick insights at a glance.
Address everyday challenges: Monitor staff workflows, track scheduling metrics, and compare productivity across different time periods. Enhance efficiency in bustling urology practices.
Uncover opportunities: Monitor costs and payments and make informed decisions based on structured data that can guide your practice’s growth.
Here, we’ll look closely at how urologists can leverage high-quality practice data. Have questions? Reach out to us for more information.
Urology Analytics Overview
For urologists, data analytics can play a pivotal role in enhancing patient relationships, fostering patient retention, identifying additional service offerings, capturing outstanding payments and optimizing staff productivity.
Reports are always specific to your practice, because they’re built on data you input during workflows or receive via APIs.
Clinical Analytics: Analyzing clinical data enables you to identify patterns across patient visits, such as visit volumes and coding trends. This allows for continuous delivery of high-quality care.
Operational Analytics: Operational data offers detailed insights into your office’s daily workflows, highlighting potential bottlenecks, staff-provider collaborations, and the impact of telehealth on your practice.
Financial Analytics: These data points provide insights into key performance indicators (KPIs) that relate to your practice’s financial strength. They can reveal revenue growth opportunities or help identify and mitigate or reverse trends that incur financial losses.
Urology Clinical Analytics
Advanced Clinical Targeting
What It Shows: Take your analytics targeting to the next level by including or excluding specific criteria to identify clinical gaps and opportunities in individual patients or groups. Quick buttons help ensure follow-up visits occur as recommended.
Why You Need It: This data is critical for delivering high-quality care while considering all relevant details that could impact patient outcomes. For example, if medication doesn’t work for certain patients, you may be authorized to try certain procedures as part of a urodynamic study. In these cases, urologists could use clinical data to see which patients had tried which medications and follow the data to send recalls for further care.
Diagnosis Drill Down
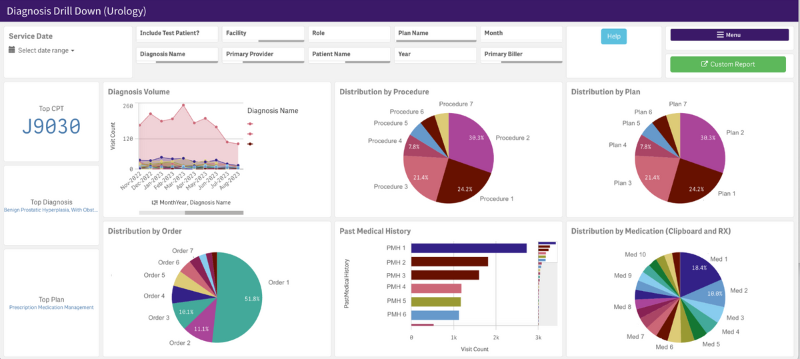
What It Shows: This view allows urologists to select a specific diagnosis and review corresponding data trends. Whether presented in a dashboard or tabular format, this data enables you to focus on trends relevant to your practice. Examples include data like the percentage of prostate cancer patients on active surveillance. This data can be broken down by risk groups or by patients receiving extracorporeal shock wave lithotripsy (ESWL) versus ureteroscopy as the primary treatment modality for kidney stones. Additionally, you can align the data with Centers for Medicare & Medicaid (CMS) benchmarking or revenue expectations.
Why You Need It: These urology analytics enable targeted care delivery, helping to support positive outcomes. For instance, tracking specific diagnosis trends helps tailor care plans, and aligning the data with CMS benchmarking ensures compliance and identifies areas requiring more thorough documentation.
Practice Census, E/M CPT Codes
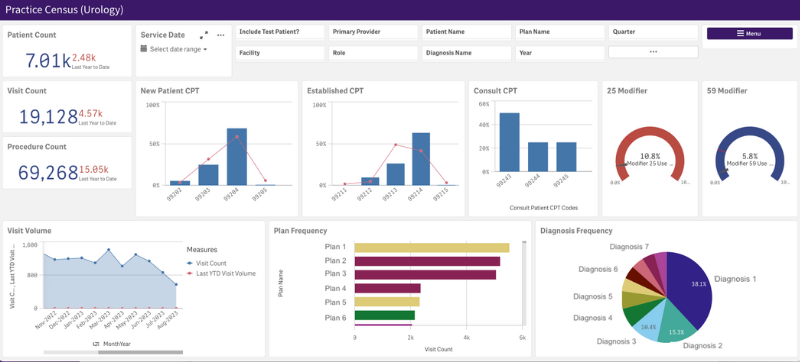
What It Shows: Compare your urology practice’s performance to other practices using CMS benchmarking. The visualization presents two sets of bars, one representing the frequency of billing for specific codes in your practice and the other illustrating how frequently the CMS population bills for those codes.
Why You Need It: These data analytics may help limit the risk of audits. Outliers are easily identifiable through the data visualization, allowing you to align your practice with other urologists, especially as Medicare transitions into MIPS Value Pathways. Moreover, this data can highlight areas where services may be provided without proper documentation. For example, if a patient presents with a chief complaint of urinary tract infection, additional questions regarding associated symptoms may qualify for additional billing. Analyzing coding reports helps identify areas where thoroughness can be improved.
CPT and ICD Coding Summary
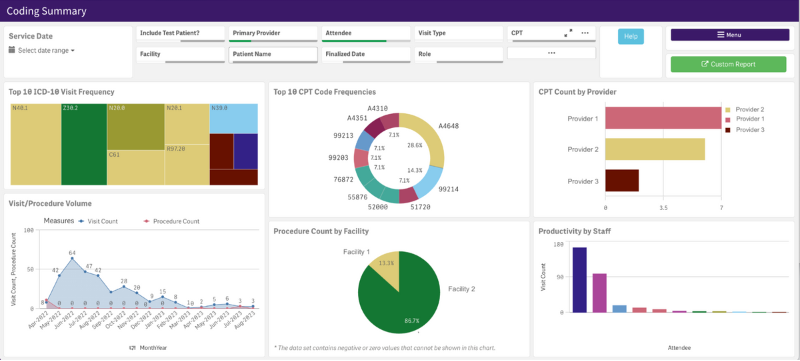
What It Shows: Obtain a quick overview of your practice’s overall distribution of Current Procedural Terminology (CPT) and International Classification of Diseases (ICD) codes, along with visit volumes. View data in a table or dashboard format for rapid analysis. These urology data analysis summaries can be centralized to focus on your entire practice or reviewed by individual facilities.
Why You Need It: Summary data analysis aids in formulating strategies. Understanding current coding distributions can provide insights for further planning and uncover additional opportunities. For instance, urologists may find it useful to see changes in the volumes of prebiopsy prostate MRIs. It used to be challenging to get these MRIs approved for prostate cancer planning, but as other data showing their value increases, payers may be more likely to approve them. Seeing an upward trend may signal to urologists that they can adjust their strategies for prostate cancer planning to include earlier MRIs.
New/Established Patient Count Trends
What It Shows: Compare trends in new and established patient counts using color-coded tables or bar graphs. Apply filters based on time period, provider and facility for a quick breakdown analysis.
Why You Need It: It is essential for urologists to understand how their patient bases are evolving, especially in light of external factors like increased demand for care amid hiring challenges. This data helps identify areas that require closer monitoring and further analysis.
Preliminary Visits
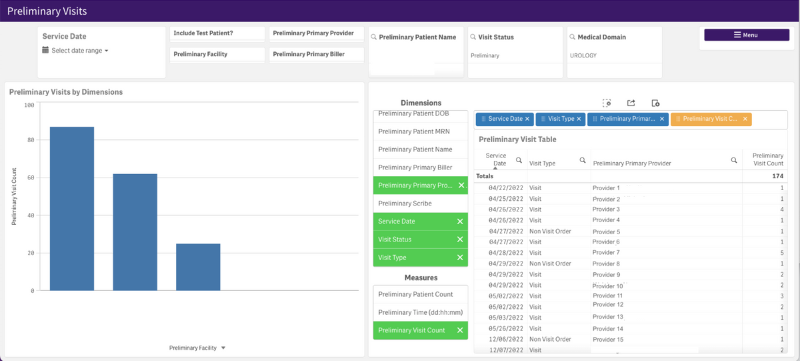
What It Shows: Track outstanding visits that need to be finalized by providers. The data can be presented in tables or bar graphs, allowing for easy identification. Filters can be applied based on facility, specific urologists or other providers.
Why You Need It: This data assists in tying up loose ends, ensuring providers complete necessary tasks to meet care and billing objectives effectively.
Urology Operational Analytics
Office Flow
What It Shows: These data analytics provide actionable insights into the flow of patients through your office. Analyze wait times using filters based on rooms, providers, attendees and days of the week. The data can be presented in a dashboard or tabular format.
Why You Need It: Optimizing office flow is crucial to enhancing patient satisfaction and engagement, ultimately aiding in preventing attrition and revenue reduction caused by long wait times.
Attendee/Scribe
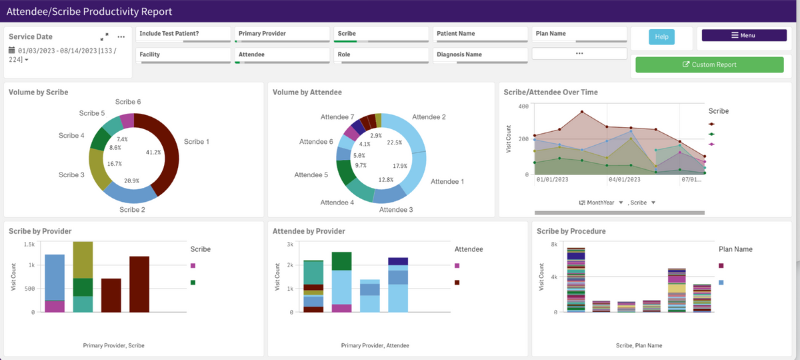
What It Shows: This report allows you to view staff productivity and visualize staff-provider collaborations or procedure allocations.
Why You Need It: These analytics shed light on the dynamics within your team, helping identify staff-related issues, assess the impact of insights from other analytics (such as bottlenecks or high new-patient numbers), and strategize effectively to address staff needs.
Time to Finalize
What It Shows: Track the time taken by providers to finalize their notes. The data can be presented in dashboard and table views.
Why You Need It: Providers exceeding benchmarks for time to finalize may indicate bottlenecks preventing timely completion of tasks. A claim cannot be submitted until the visit is finalized, so not completing this task could result in payment delays. This report also highlights training opportunities for new hires to familiarize themselves with the urology EHR system by ModMed, streamlining workflows and improving efficiency throughout the day.
Practice Trends
What It Shows: Review encounter trends since the beginning of COVID-19, including telehealth utilization over time and rates of change in different time periods.
Why You Need It: Staying ahead of trends is crucial for urologists to meet the demand for telehealth options. This data helps in resource allocation, investment decisions in patient engagement and portals, and overall practice planning to provide digitized experiences aligning with patient expectations.
Urology Financial Analytics
Productivity Report
What It Shows: This comprehensive view allows you to gain valuable insights into the productivity of your urology practice. Assess charges, payments, adjustments, patient and encounter counts. Apply filters based on location, provider and other factors. Discover data visualizations with numerical callouts, timelines, and line or bar graphs that spotlight outliers.
Why You Need It: A dashboard-level view of your urology practice productivity helps you synthesize insights from granular data and determine where more detailed reports are necessary.
Appointment Utilization
What It Shows: Evaluate provider schedule saturation levels and assess how far in advance your practice is booked. Analyze appointment utilization over time and by facility, including the hours and minutes spent compared to the scheduled time.
Why You Need It: This information can empower you to maintain a steady flow of patients over time, enabling balanced schedules for more efficient workdays while optimizing unused time slots. If you offer patients self-scheduling, these insights may help you see how to configure your self-scheduling settings.
Appointment Summary
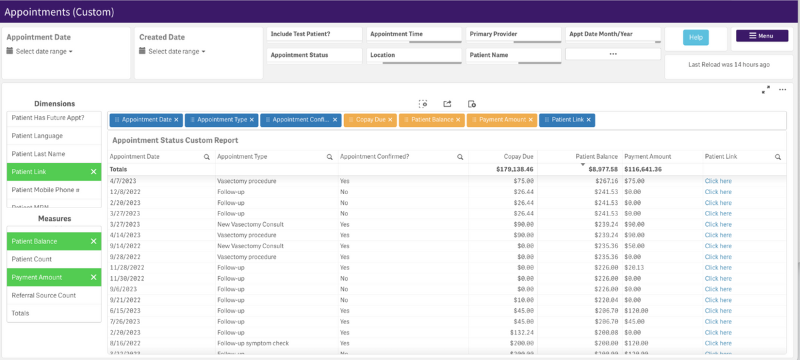
What It Shows: Generate custom views using the appointment status field to identify patients who have missed urology appointments. This data can also show if the appointment was confirmed, if the patient had a copay or balance due, and what money may have been collected.
Why You Need It: When used to evaluate missed appointments, this data assists in plugging appointment gaps and addressing their impact on both patient care and your practice’s financial performance. By combining these insights with patient engagement strategies, you can improve appointment adherence and patient satisfaction. You can also use this data while the patient is still in the office to see what may be owed, eliminating the need to send statements afterwards.
Payment Variance
What It Shows: The report provides a breakdown of the payment variance formula: (payment allowed + patient responsible) – fee schedule allowed. Identify discrepancies between the actual payments received by your urology practice and the expected payments based on your fee schedule.
Why You Need It: Monitoring underpayment is vital for maintaining financial health. Regularly running this report allows you to take timely action on unclaimed amounts within the specified time limitations.
Allowable Reporting
What It Shows: Gain insights into expected payments based on open allowable reporting and payer contracts. This specialized urology version of an account aging report provides a visual representation of your practice’s financial health over time, allowing for informed decision-making.
Why You Need It: This report serves as a valuable data visualization tool, enabling you quickly to see your practice’s expected performance. If the numbers differ from your expectations, you can identify successful strategies to repeat and scale or make necessary corrections.
Appointments Missing Charges
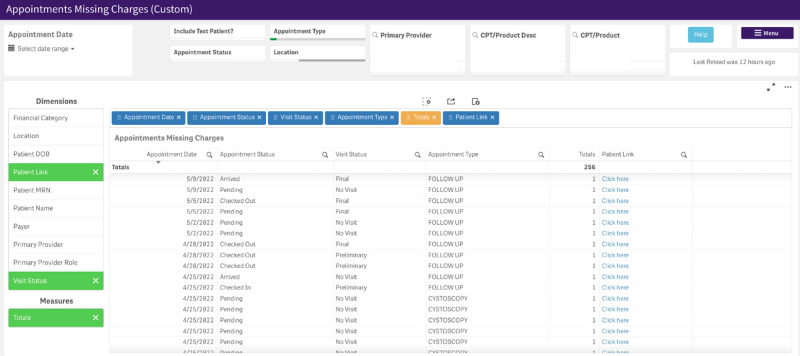
What It Shows: Analyze completed appointments that lack associated charges, uncovering potential workflow issues related to visit finalization speed, visit documentation and encounter creation. Customize tags within views to identify promptly potentially missed revenue areas, ensuring timely charge creation and posting.
Why You Need It: This report helps identify workflow inefficiencies and areas where revenue may be slipping through the cracks. By addressing these issues, you can work to improve revenue capture and streamline your billing processes.
Unposted and Unbilled Posted Charges
What It Shows: Unposted Charges provides a detailed overview of preliminary bills that haven’t been posted in the system. Unbilled Posted Charges focuses on charges that have been posted, but not sent successfully to payers. These analytics offer clear visibility into revenue that may be at risk without appropriate action.
Why You Need It: These insights enable you to identify revenue opportunities that might otherwise be overlooked and take proactive control of billing processes, enabling thorough, efficient and timely completion of billing cycles. Additionally, these analytics can help identify internal scrub failures and other issues that may hinder appropriate charge submissions.
Targeting Reports
What They Show: Targeting reports let you include or exclude specific criteria when analyzing data related to specific patient populations. Within these populations, you can search for scenarios such as patients with a particular diagnosis who haven’t undergone a specific procedure, and who their payers are.
Why You Need Them: These customizable reports facilitate a shift from practice-level insights to facility-level insights and support better patient outcomes. By leveraging this data, you can identify patients requiring deeper engagement and assess the effectiveness of different payers in meeting your patients’ needs.
Production Summary
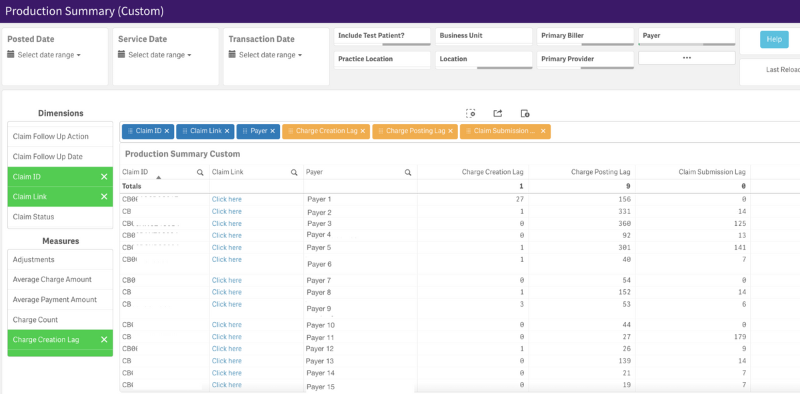
What It Shows: This table allows more than 100 ways to slice data related to the time it takes to complete each step in the revenue cycle management process. Each step is time-stamped for exact measurement. Commonly used dimensions include provider, data, location, payer, financial category and others.
Why You Need It: This data helps to identify bottlenecks in your revenue cycle management processes. You may also use it to surface training opportunities for staff who may be responsible for areas where there are slowdowns. You can also use this data to inform discussion points for your next payer contract negotiation. If certain payers are slow to pay, this report can reveal their timing.
AR Last Touch
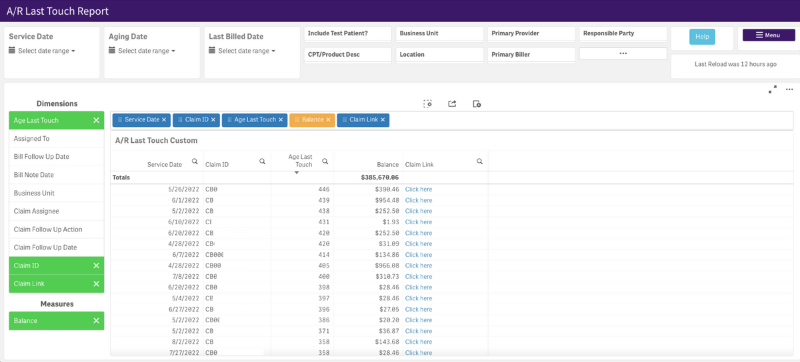
What It Shows: This report shows how long it’s been since a claim has been actioned, using dates and time stamps. You can sort results by account balance and billable amount.
Why You Need It: Use this report to monitor timely payment and identify lags in responses to billing corrections. This information can also help billing groups prioritize claims on which to take action.
Leverage your urology data
Explore how urology data analytics can boost your practice’s performance in a measurable way. ModMed urology EHR analytics offer high-contrast graphics and easily accessible tables, empowering you to make powerful decisions and achieve predictable results. Ready to start leveraging the power of your practice’s unique data? Book a demo to see it in action.
This blog is intended for informational purposes only and does not constitute legal or medical advice. Please consult with your legal counsel and other qualified advisors to ensure compliance with applicable laws, regulations and standards.


